Overton Insights Poll: Texas · September 2026
50.0 %
2026 U.S. Senate
50.0%

of the vote goes to each of Talarico and Paxton, a statistical dead heat.

Without leaners allocated, Talarico edged Paxton 44.0% to 43.4%, with 12.6% undecided.

If the election for U.S. Senate were held today, who would you vote for?
Includes leaners
James TalaricoJames Talarico (D)50.0%
Ken PaxtonKen Paxton (R)50.0%
51.2 %
2026 Governor
51.2%

of voters chose incumbent Governor Abbott over Hinojosa.

Without leaners allocated, Abbott edged Hinojosa 46.9% to 45.8%, with 7.3% undecided.
If the election for Governor were held today, who would you vote for?
Includes leaners
Greg AbbottGreg Abbott (R)51.2%
Gina HinojosaGina Hinojosa (D)48.8%
29.5 %
2028 Republican Primary
29.5%

of Texas likely voters choose Marco Rubio, with 28.8% choosing JD Vance.

Interestingly, Rubio leads the field in the Lone Star State while home-state Senator Ted Cruz draws only 6.5%.
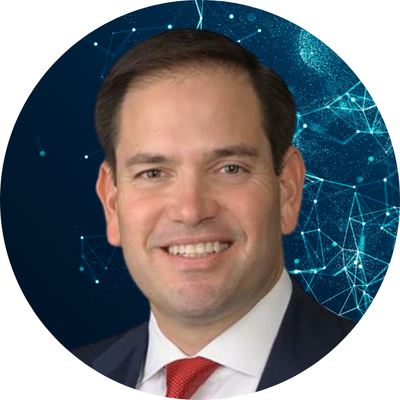

If the 2028 Republican primary for President were held today, who would you vote for?
Marco RubioMarco Rubio29.5%
J.D. VanceJ.D. Vance28.8%
Ron DeSantisRon DeSantis11.2%
Ted CruzTed Cruz6.5%
Tucker CarlsonTucker Carlson5.9%
Donald Trump Jr.Donald Trump Jr.4.5%
Would Not Vote13.6%
28.4 %
2028 Democratic Primary
28.4%

of likely Texas voters choose former Vice President Kamala Harris.

Buttigieg, Ossoff, Newsom, and Ocasio-Cortez are all in a tight race for second.
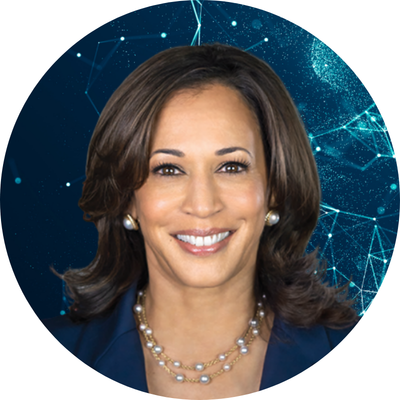
If the 2028 Democratic primary for President were held today, who would you vote for?
Kamala HarrisKamala Harris28.4%
Pete ButtigiegPete Buttigieg14.2%
Jon OssoffJon Ossoff11.6%
Gavin NewsomGavin Newsom11.5%
Alexandria Ocasio-CortezAlexandria Ocasio-Cortez10.6%
Mark KellyMark Kelly9.4%
Josh ShapiroJosh Shapiro3.9%
Andy BeshearAndy Beshear0.9%
Rahm EmanuelRahm Emanuel0.7%
Would Not Vote8.8%
Hypothetical U.S. Senate Matchups

Suppose instead that these were the candidates. If the election for U.S. Senate were held today, who would you vote for?

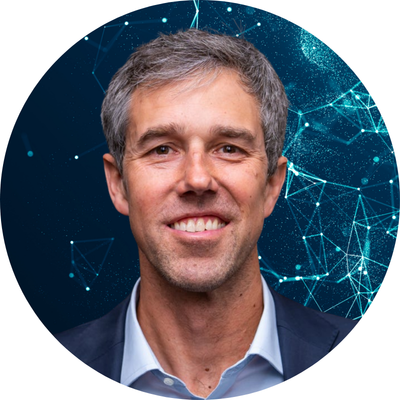
Talarico vs. Cornyn
James TalaricoJames Talarico (D)43.6%
John CornynJohn Cornyn (R)42.7%
O'Rourke vs. Paxton
Beto O'RourkeBeto O'Rourke (D)42.8%
Ken PaxtonKen Paxton (R)48.9%
Crockett vs. Paxton
Jasmine CrockettJasmine Crockett (D)42.8%
Ken PaxtonKen Paxton (R)48.8%
38.3 %
How Texans See Texas
38.3%

of voters see Texas as a purple state, meaning competitive between the two parties.

Even 28.7% of GOP primary voters consider their own state to be purple, and voters under 30 see it purple by 64.7% – 30.5%.

Politically speaking, which of the following best describes Texas today?

A red state Reliably Republican57.0%
A purple state Competitive between the two parties38.3%
A blue state Reliably Democratic4.7%
63.6 %
License Plate Reader Cameras
63.6%

oppose ALPR cameras such as Flock.

Opposition crosses party lines, with Democrats (-16.6%) and Republicans (-61.8%) opposing these cameras.

Do you support or oppose local governments' use of automatic license plate reader cameras, such as Flock cameras, at public intersections?
Oppose63.6%
Support28.1%
Unsure8.3%
Methodology
  • Poll of 1,167 likely voters in Texas
  • Estimated margin of error: ±2.9%
  • Only respondents who passed data quality checks were included in the final results
  • Fieldwork: August 24 to August 26, 2026
  • Respondents were recruited via MMS text message invitations sent to a random sample of cellphone numbers matched to Texas registered voter files
  • Results were weighted using iterative weighting across party primary intent, gender, age, education, race, living situation, time in Texas, and political philosophy
  • Due to weighting and rounding, percentages may not always total exactly 100%

Get Our Latest Poll Results Delivered To Your Inbox

Stay informed with the most up-to-date insights on public opinion. Be the first to know about shifting trends and key findings that matter to you.

This field is for validation purposes and should be left unchanged.